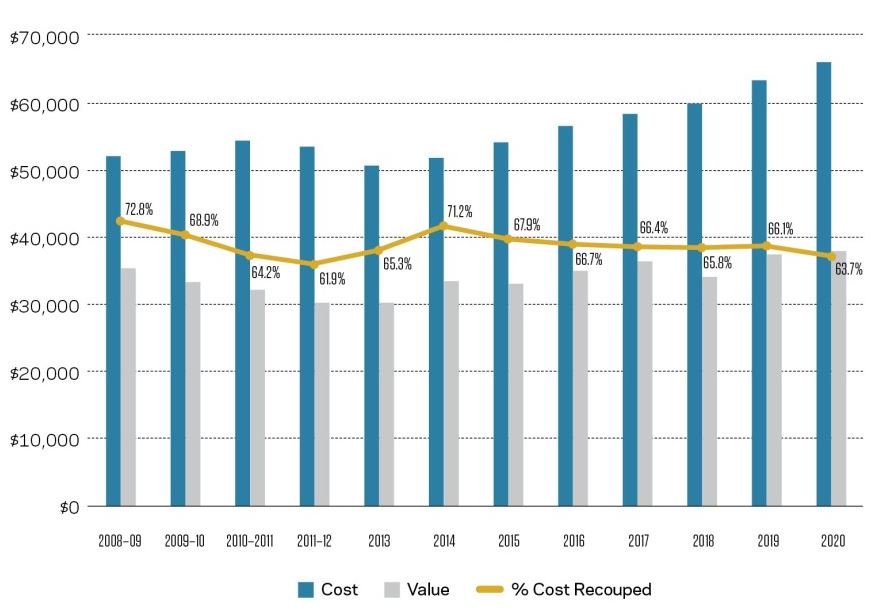
According to Remodeling magazine, The 2020 Cost vs. Value report (www.costvsvalue.com) illustrates an unsurprising inclined trend in costs for all the 22 remodeling projects although there is a consistent dip in the perceived value of those home improvement projects at the time of home sale, as projected by real estate professionals in more than 100 metro areas across the United States.
This results in a slight slump on the return on investment for nearly all projects relative to the trends in the previous year’s report.
Though consumers are growing more and more anxious about the U.S. economy, at the very least they can stay certain about the return on investment (ROI) for remodeling.
Cost vs Value on Yearly Trends

Cost and value figures reflect averages for 15 projects that have appeared in Cost vs. Value over the last dozen years. As project costs have consistently risen, the value-over-cost ratio, as a percentage, reveals a shaky decline over the last six years in the cost recouped for these remodeling projects.
Cost vs Value on National Averages
| Project | Trend | Job Cost | Value at Sale | Cost Recouped |
|---|---|---|---|---|
| Manufactured Stone Veneer | Up | $9,357 | $8,943 | 96% |
| Garage Door Replacement | Down | $3,695 | $3,491 | 94% |
| Minor Kitchen Remodel | Down | $23,452 | $18,206 | 78% |
| Siding Replacement (Fiber Cement) | New | $17,008 | $13,195 | 78% |
| Siding Replacement (Vinyl) | Down | $14,359 | $10,731 | 75% |
| Window Replacement (Vinyl) | Down | $17,461 | $12,761 | 72% |
| Deck Addition (Wood) | Down | $14,360 | $10,355 | 72% |
| Window Replacement (Wood) | Down | $21,495 | $14,804 | 69% |
| Entry Door Replacement (Steel) | Down | $1,881 | $1,294 | 69% |
| Deck Addition (Composite) | Down | $19,856 | $13,257 | 67% |
| Roofing Replacement (Asphalt Shingles) | Down | $24,700 | $16,287 | 66% |
| Bathroom Remodel Midrange | Down | $21,377 | $13,688 | 64% |
| Universal Design Bathroom | Down | $34,643 | $21,463 | 62% |
| Roofing Replacement (Metal) | - | $40,318 | $24,682 | 61% |
| Major Kitchen Remodel Midrange | Down | $68,490 | $40,127 | 59% |
| Master Suite Addition Midrange | - | $136,739 | $80,029 | 59% |
| Bathroom Remodel Upscale | Down | $67,106 | $37,995 | 57% |
| Bathroom Addition Upscale | Down | $91,287 | $49,961 | 55% |
| Bathroom Addition Midrange | Down | $49,598 | $26,807 | 54% |
| Major Kitchen Remodel Upscale | Down | $135,547 | $72,993 | 54% |
| Grand Entrance (Fiberglass) | Down | $9,254 | $4,930 | 53% |
| Master Suite Addition Upscale | Up | $282,062 | $145,486 | 52% |
The table above is sorted by the highest return on investment which ranks all 22 projects in the Cost vs. Value report.
“Trend” shows the change in percentage of cost recouped at the time of home sale compared with the 2019 report.
Cost vs Value by Regional United States
Percentage of costs recouped on re-modeling projects for each region of the country.
| Projects | Middle Atlantic | New England Area | South Atlantic | East-North Central | West-North Central | East-South Central | West-South Central | Mountain | Pacific |
|---|---|---|---|---|---|---|---|---|---|
| Bathroom Addition (Midrange Project) | 51.0% | 51.1% | 53.9% | 50.8% | 50.3% | 58.4% | 60.5% | 52.1% | 58.9% |
| Bathroom Addition (Upscale Project) | 52.3% | 53.3% | 54.0% | 55.3% | 50.0% | 46.7% | 63.3% | 54.1% | 66.4% |
| Bathroom Remodel (Midrange Project) | 62.5% | 63.2% | 66.7% | 63.8% | 52.5% | 56.0% | 65.7% | 62.7% | 65.0% |
| Bathroom Remodel (Upscale Project) | 56.2% | 58.2% | 58.6% | 57.1% | 46.1% | 48.6% | 61.3% | 57.8% | 54.0% |
| Universal Design Bathroom | 61.4% | 66.0% | 61.2% | 61.1% | 53.3% | 53.1% | 61.8% | 60.7% | 66.4% |
| Minor Kitchen Remodel (Midrange Project) | 79.7% | 74.2% | 76.3% | 69.9% | 73.9% | 77.6% | 76.4% | 79.4% | 86.6% |
| Major Kitchen Remodel (Midrange Project) | 56.3% | 55.6% | 58.7% | 56.7% | 52.7% | 58.0% | 61.3% | 58.1% | 63.5% |
| Major Kitchen Remodel (Upscale Project) | 52.3% | 54.1% | 53.6% | 54.3% | 49.5% | 50.9% | 54.9% | 51.2% | 57.4% |
| Master Suite Addition (Midrange Project) | 52.9% | 57.1% | 59.1% | 55.7% | 46.2% | 43.1% | 61.7% | 56.9% | 65.2% |
| Master Suite Addition (Upscale Project) | 52.9% | 48.7% | 52.3% | 50.5% | 41.1% | 40.0% | 54.8% | 50.8% | 55.0% |
| Deck Addition (Composite) | 73.6% | 72.4% | 66.6% | 64.6% | 44.3% | 65.6% | 57.7% | 66.7% | 70.6% |
| Deck Addition (Wood) | 77.4% | 67.5% | 77.0% | 66.6% | 49.0% | 81.0% | 65.7% | 70.1% | 77.1% |
| Entry Door Replacement (Steel) | 71.4% | 59.2% | 67.0% | 63.7% | 59.0% | 77.2% | 72.8% | 546.0% | 87.9% |
| Grand Entrance (Fiberglass) | 56.0% | 51.0% | 52.7% | 51.2% | 43.9% | 52.1% | 53.4% | 48.4% | 61.1% |
| Garage Door Replacement | 106.3% | 99.5% | 88.7% | 79.1% | 58.3% | 132.7% | 73.3% | 96.1% | 117.1% |
| Manufactured Stone Veneer | 89.8% | 57.8% | 94.0% | 66.0% | 60.7% | 92.1% | 91.1% | 100.0% | 119.5% |
| Siding Replacement Giber Cement] | 95.5% | 73.9% | 90.8% | 71.0% | 56.1% | 99.1% | 77.1% | 78.6% | 78.0% |
| Siding Replacement (Vinyl) | 76.2% | 76.6% | 76.0% | 69.3% | 56.9% | 120.9% | 70.4% | 74.4% | 74.9% |
| Roofing Replacement (Asphalt Shingles) | 64.8% | 65.8% | 68.2% | 61.2% | 45.0% | 57.0% | 65.4% | 61.6% | 75.3% |
| Roof Replacement (Metal) | 57.3% | 63.3% | 65.3% | 58.4% | 43.1% | 52.8% | 58.5% | 61.1% | 65.4% |
| Window Replacement (Wood) | 72.1% | 75.4% | 66.1% | 67.1% | 48.6% | 82.1% | 63.7% | 69.8% | 72.9% |
| Window Replacement (Vinyl) | 75.1% | 72.6% | 73.2% | 70.1% | 53.4% | 84.2% | 64.1% | 76.5% | 74.5% |
The power of Cost vs. Value is its regional specificity (which is even more detailed at the metro level).
The above table offers an overview of the regional distinction, which is occasionally dramatic, in the percentage of costs recouped for 22 remodeling projects.


